


Error handling and failure management are crucial aspects of developing robust and reliable software applications. In a Go system, these practices play a vital role in ensuring smooth execution and identifying and addressing potential issues. This article explores the key principles of error handling in Go, the importance of logging, and the benefits of Application Performance Monitoring (APM), and briefly touches upon tracing.
Error Handling in Go
In Go, errors are treated as values rather than exceptional control flows. This design philosophy encourages developers to handle errors explicitly and maintain a clear and predictable flow of code execution. By returning errors as values, Go enables efficient error propagation across function calls, facilitating a clean and readable code structure.
Compared to some other languages that rely on exceptions for error handling, Go's approach ensures that errors are not overlooked or unintentionally ignored. It encourages developers to handle errors explicitly, promoting a proactive mindset toward error management and system stability.
The most idiomatic form to represent an error in Go is to return it as the last value in a function:
f, err := os.Open("filename.ext")
if err != nil {
    log.Fatal(err)
}
// do something with the open *File f
In which error is simply represented by an interface:
type error interface {
    Error() string
}
To generate custom errors, we can implement the error interface in a struct, as per our requirements.
type DivZero struct{}
func (myerr *DivZero) Error() string{
  return "Cannot divide by 0!"
}
Or to create new errors in Go, we can do:
errors.New("Cannot divide by 0!")
// or
fmt.Errorf("Cannot divide by %v!", 0)
Logging
Logging plays a vital role in capturing and recording relevant information about the system's operation and any encountered errors. When an error occurs, an error log can contain valuable details such as timestamps, error messages, stack traces, and contextual information that can assist in diagnosing and resolving issues.
To protect sensitive data, log redaction techniques can be employed to mask or obfuscate any confidential or personally identifiable information (PII) present in the logs. This ensures compliance with data protection regulations and prevents unauthorized access to sensitive information.
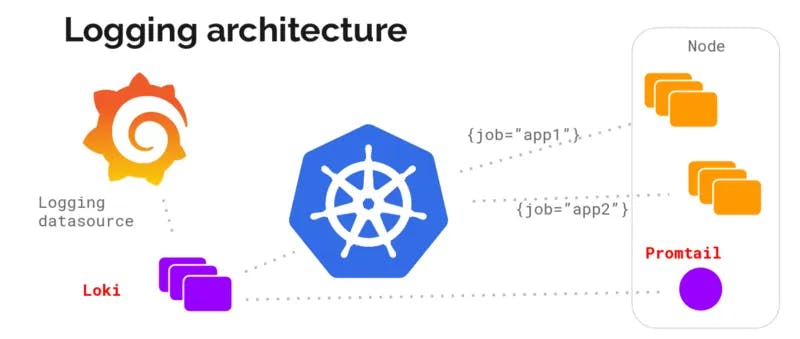
Log aggregation is the mechanism for capturing, normalizing, and consolidating logs from different sources to a centralized platform for correlating and analyzing the data. This aggregated data then acts as a single source of truth for different use cases, including troubleshooting application performance issues or errors, identifying infrastructure bottlenecks, or finding the root cause of a cyberattack.
Some of the popular log aggregation tools include Grafana Loki and Elastic Stack (formerly known as ELK Stack).
Loki is a datastore optimized to efficiently store log data. Unlike other logging systems, a Loki index is built from labels, leaving the original log message unindexed.
The Elastic Stack is a collection of four open-source products - Elasticsearch, Logstash, Kibana and Beats. Together these products form a complete stack that can be used for monitoring, troubleshooting and securing applications. Beats and Logstash take care of data collection and processing, Elasticsearch indexes and stores the data, and Kibana provides a user interface for querying the data and visualizing it.

Go also offers various log packages, such as the popular logrus, zap, and zerolog, which provide extensive features and flexibility for capturing logs efficiently. These packages offer customizable logging formats, log level control, and integration with log aggregation stacks.
Performance comparison between different log packages
Logging a message and ten fields:
| Library | Time | Bytes allocated | Objects allocated |
| Zerolog | 767 ns/op | 552 B/op | 6 allocs/op |
| Zap | 848 ns/op | 704 B/op | 2 allocs/op |
| Zap (sugared) | 1363 ns/op | 1610 B/op | 20 allocs/op |
| Logrus | 5661 ns/op | 6092 B/op | 78 allocs/op |
| apex/log | 15332 ns/op | 3832 B/op | 65 allocs/op |
| Log15 | 20657 ns/op | 5632 B/op | 93 allocs/op |
Logging a message with a logger that already has ten fields of context:
| Library | Time | Bytes allocated | Objects allocated |
| Zerolog | 52 ns/op | 0 B/op | 0 allocs/op |
| Zap | 283 ns/op | 0 B/op | 0 allocs/op |
| Zap (sugared) | 337 ns/op | 80 B/op | 2 allocs/op |
| Logrus | 4309 ns/op | 4564 B/op | 63 allocs/op |
| apex/log | 13456 ns/op | 2898 B/op | 51 allocs/op |
| Log15 | 14179 ns/op | 2642 B/op | 44 allocs/op |
Logging a static string without any context or printf-style templating:
| Library | Time | Bytes allocated | Objects allocated |
| Zerolog | 50 ns/op | 0 B/op | 0 allocs/op |
| Zap | 236 ns/op | 0 B/op | 0 allocs/op |
| Standard library | 453 ns/op | 80 B/op | 2 allocs/op |
| Zap (sugared) | 337 ns/op | 80 B/op | 2 allocs/op |
| Logrus | 1244 ns/op | 1505 B/op | 27 allocs/op |
| apex/log | 2751 ns/op | 584 B/op | 11 allocs/op |
| Log15 | 5181 ns/op | 1592 B/op | 26 allocs/op |
Application Performance Monitoring (APM)
Application Performance Monitoring (APM) is a practice that focuses on monitoring and managing the performance of software applications. It involves gathering and analyzing various metrics, such as response times, throughput, resource consumption, and error rates. APM tools provide real-time insights into the health and performance of a Go system, helping identify bottlenecks and areas for optimization.
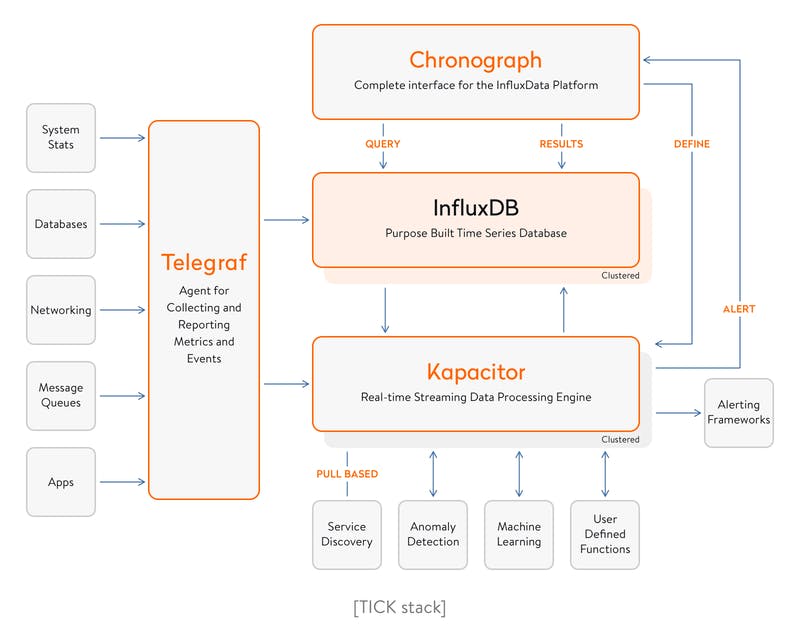
One widely used APM stack in the Go community is the TICK Stack, which consists of Telegraf, InfluxDB, Chronograf, and Kapacitor. This stack enables efficient collection, storage, visualization, and analysis of application metrics, allowing developers to identify performance issues and make data-driven improvements.
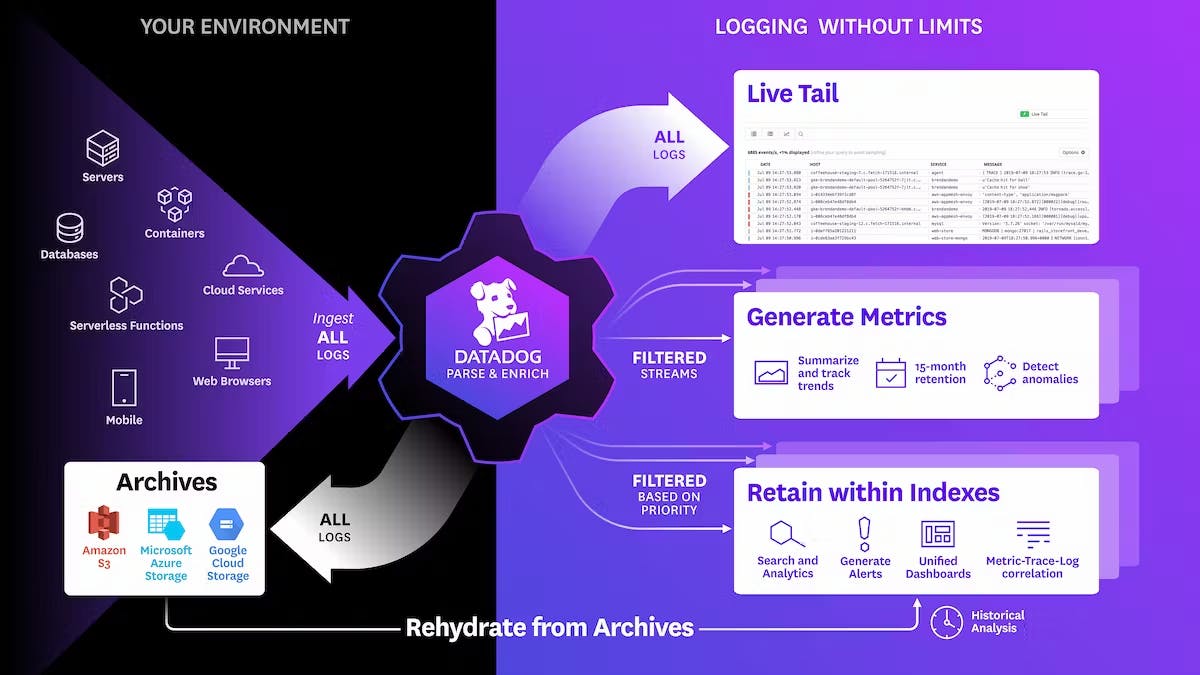
There are also other popular APM platforms that can be easily integrated with a Go system. DataDog, for example, is a well-known platform created in 2010. DataDog provides multiple functionalities, such as data integration, infrastructure monitoring, logging, and even RUM (Real User Monitoring).
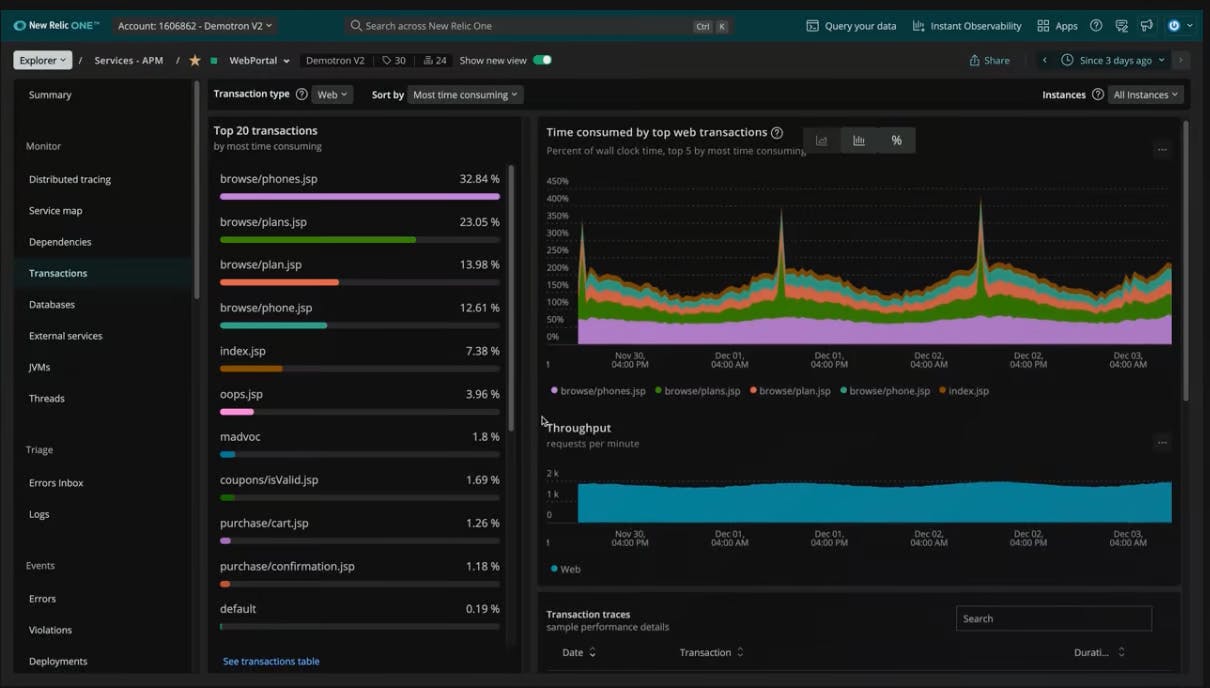
New Relic is another observability platform that helps you build better software. With New Relic, you can bring in data from any digital source so that you can fully understand your system, analyze that data efficiently, and respond to incidents before they become problems.
Tracing
Tracing involves capturing and analyzing the flow of requests through a distributed system. It helps understand the interactions between different components, identify latency bottlenecks, and diagnose errors and performance issues. Tracing solutions like Jaeger and OpenTelemetry provide powerful tools to trace and visualize requests in a Go system.
OpenTelemetry is a powerful observability framework designed to help developers gain deep insights into the behavior and performance of their applications. With OpenTelemetry, you can easily instrument your code to collect and analyze distributed traces, which provide detailed visibility into the execution paths of your application's requests across various components and services.

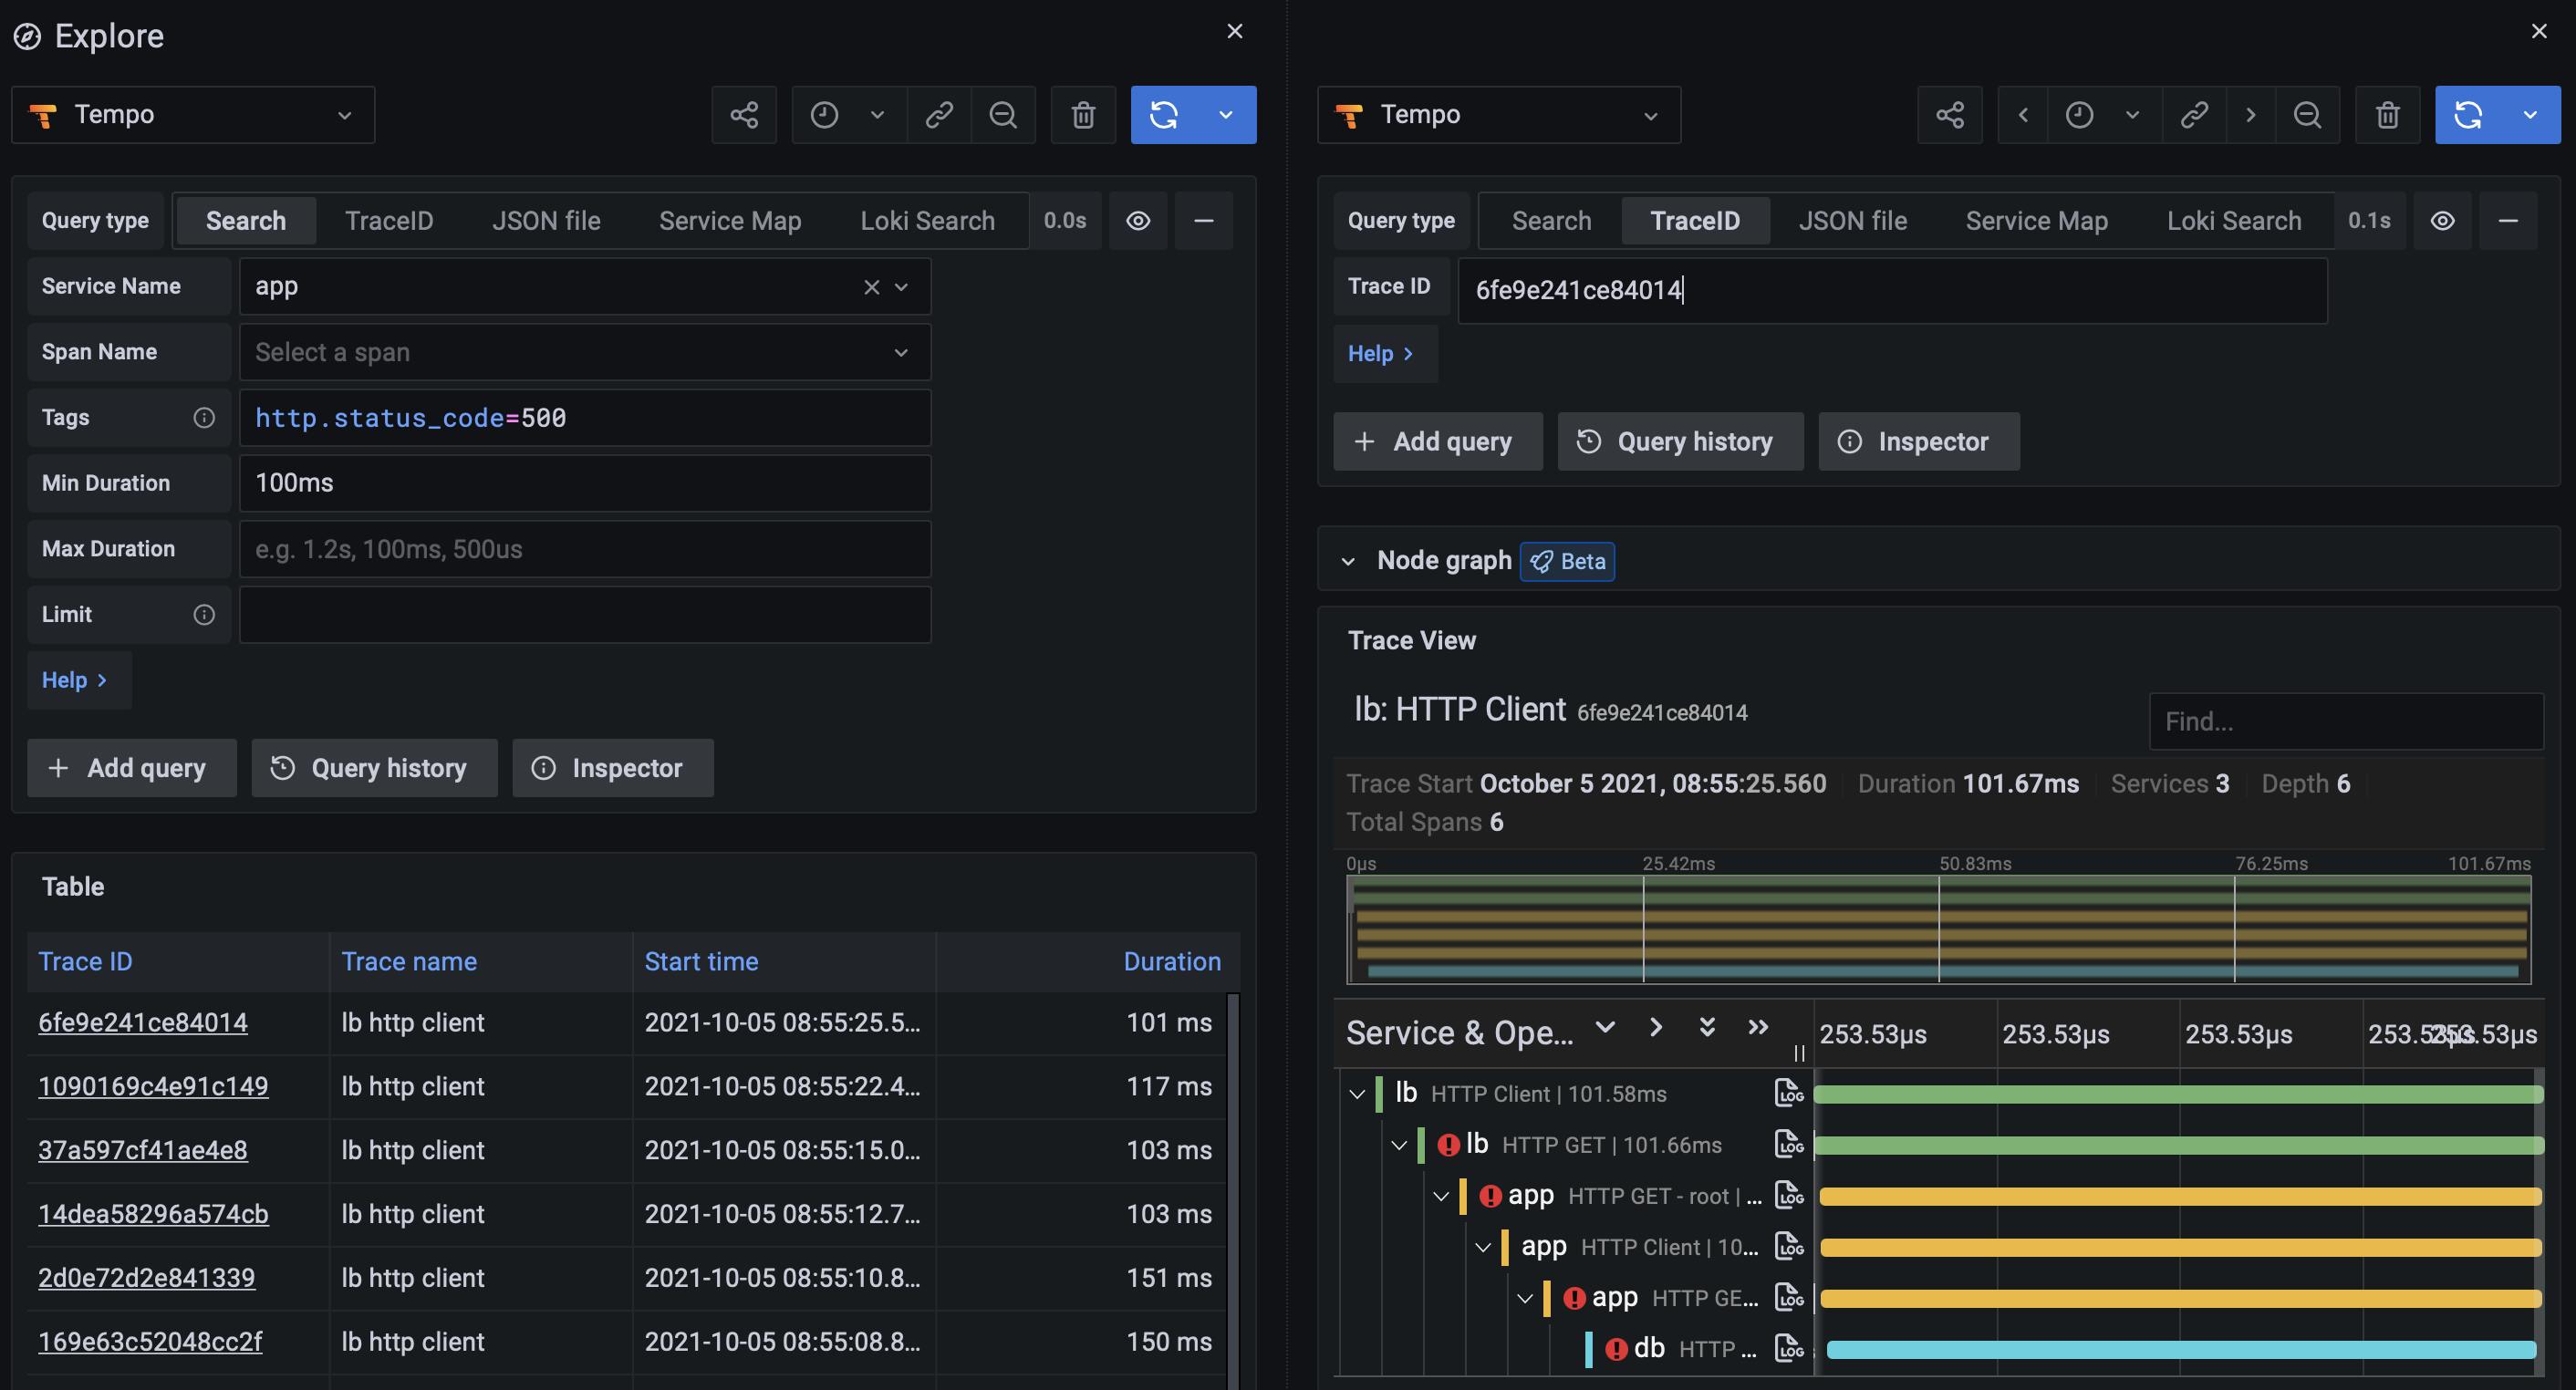
Grafana Tempo is an open-source, easy-to-use, and high-scale distributed tracing backend. Tempo is cost-efficient, requiring only object storage to operate, and is deeply integrated with Grafana, Prometheus, and Loki. Tempo can ingest common open-source tracing protocols, including Jaeger, Zipkin, and OpenTelemetry.
Conclusion
Error handling and failure management are essential aspects of building reliable Go systems. By treating errors as values and enforcing explicit error handling, Go encourages developers to address errors proactively, leading to more stable and predictable code. Logging, APM, and tracing further enhance the error management process, enabling developers to capture relevant information, monitor system performance, and diagnose and resolve issues efficiently. Embracing these practices empowers developers to create robust and resilient Go applications that can gracefully handle errors and provide a seamless user experience.
For error handling, each project should define its own set of rules and guidelines that align with its specific structure. These rules can be flexible and case-by-case, as long as they follow the “errors are values” philosophy of Go.
For logging, choosing a reliable log library and a good log aggregation stack can be of the essence. ZeroLog or Zap are both excellent options, as they both have good performance and low memory allocation. If your application requires log aggregation, consider the trade-offs between the Elastic Stack and Grafana Loki. Elastic Stack was the norm and was highly reliable, while Grafana Loki is newer and possibly has better performance.
For monitoring and metrics, DataDog and New Relic offer out-of-the-box support and integration. They also come with many extra functionalities to help you monitor your application. If pricing is a concern, then the TICK Stack is also a good option, but it will require more setup.
And lastly, for tracing, OpenTelemetry is pretty much the standard nowadays. DataDog and New Relic also offer tracing capability, but if you want to try something new, Grafana Tempo can be a good choice.
Contributing
At Dwarves, we encourage our people to read, write, share what we learn with others, and contributing to the Brainery is an important part of our learning culture. For visitors, you are welcome to read them, contribute to them, and suggest additions. We maintain a monthly pool of $1500 to reward contributors who support our journey of lifelong growth in knowledge and network.
Love what we are doing?
Check out our products
Hire us to build your software
Join us, we are also hiring
Visit our Discord Learning Site
Visit our GitHub