Introduction
Performance issues in software applications, including Go programs, can have negative consequences on user experience and business outcomes. These issues can arise from various factors, such as inefficient algorithms, blocking operations, and excessive memory usage.
What causes performance issues?
One common cause of performance problems is the use of inefficient algorithms, especially when dealing with large datasets. These algorithms require more CPU cycles and memory resources, leading to slower overall application performance. Examples include brute-force search methods and ineffective sorting algorithms. This imbalance in resource distribution can limit access to resources for certain functions.
Another factor that can hinder performance is blocking operations. These occur when an application waits for I/O activities to complete, such as reading or writing data to disk or establishing network connections. During this waiting period, the application cannot perform other useful tasks, resulting in decreased performance.
Excessive memory usage can also contribute to performance issues, particularly on systems with limited resources. If an application consumes more memory than is available, the system may start swapping data to disk, significantly slowing down the application. Inefficient memory management, including memory leaks, can further exacerbate this problem.
Slow applications not only provide a poor user experience but also lead to dissatisfied users and potential revenue loss. Therefore, optimizing Go applications is vital to ensure optimal performance and user satisfaction.
Using pprof and trace to diagnose performance
Both pprof and trace are built-in tools in Go to help profile and gather detailed information about your program's execution. To effectively identify and address performance issues, profiling and tracing should be incorporated into the development process.
pprof package
The pprof package is a built-in tool in Go that allows developers to profile their programs and gather data on CPU and memory usage. This data can then be analyzed to identify performance issues. By using pprof, developers can easily measure and pinpoint functions that use more CPU or allocate the most memory than expected.
Types of profiles
There are different types of profiles in Go and they can be generated using the pprof package. In this section we will take a look at these different profiles and their usefulness:
CPU profile: measures how the functions consume different amounts of CPU time, making it easier to identify which functions consume more of it and could be potential bottlenecks.
Memory profile: measures how an application makes use of memory and which parts of the application allocate more memory.
Block profile: this shows where the program is blocking (e.g. I/O or synchronization primitives), making it easier to identify areas where concurrency may need to be improved.
Goroutine profile: makes it easy to detect areas with too much parallelism or where concurrency might need to be improved, by returning statuses of running, blocked and waiting.
Trace profile: this captures a detailed log of events that occur during the execution of a program, e.g. goroutine creation and destruction, scheduling, network activity, and blocking operations. It is very useful in a detailed analysis of an application’s performance.
trace package
The trace tool is a valuable resource for gathering detailed information about your program's execution. It provides insights into the behavior of goroutines, channels, and network requests. By visualizing a timeline of events, it aids in the detection of performance issues and other bugs.
trace captures data on various events, such as the creation, destruction, blocking, and unblocking of goroutines, network activity, and garbage collection. Each event is assigned a timestamp and a unique ID, facilitating the examination of event sequences and their interdependencies.
Collecting data using pprof and trace
Let's make a Golang application example
package main

import (
    "fmt"
    "math/rand"
    "os"
    "runtime/pprof"
    "runtime/trace"
)

func main() {
    // Create a CPU profile file
    f, err := os.Create("profile.prof")
    if err != nil {
        panic(err)
    }
    defer f.Close()

    // Start CPU profiling
    if err := pprof.StartCPUProfile(f); err != nil {
        panic(err)
    }
    defer pprof.StopCPUProfile()

    // Start tracing
    traceFile, err := os.Create("trace.out")
    if err != nil {
        panic(err)
    }
    defer traceFile.Close()

    if err := trace.Start(traceFile); err != nil {
        panic(err)
    }
    defer trace.Stop()

    // Generate some random numbers and calculate their squares
    for i := 0; i < 100000; i++ {
        n := rand.Intn(100)
        s := cube(n)
        fmt.Printf("%d^3 = %d\\\\n", n, s)
    }
}

func cube(n int) int {
    return n * n * n
}
The above program does:
The
pprof.StartCPUProfilefunction initiates CPU profiling, which results in the creation of a profile file that can be analyzed later.The defer
pprof.StopCPUProfile()statement makes sure that CPU profiling is stopped at the end of the program, whether it finishes normally or due to an error.In the main loop, we create some CPU-bound workload by calling
rand.Intn(100)100000 times. This creates random integers between 0 and 99 and is a CPU-intensive operation that we can profile.
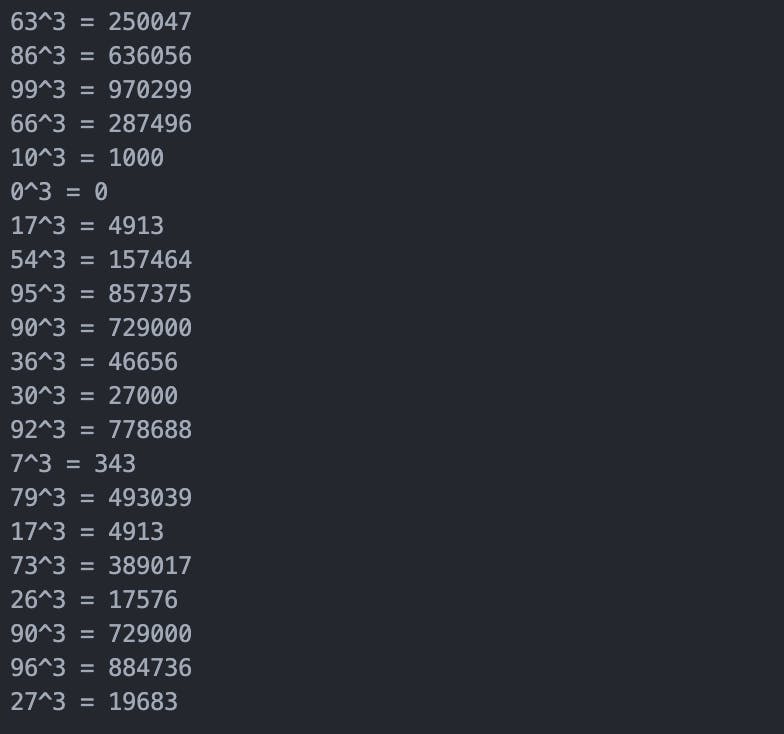
When running the program, we will have the results:

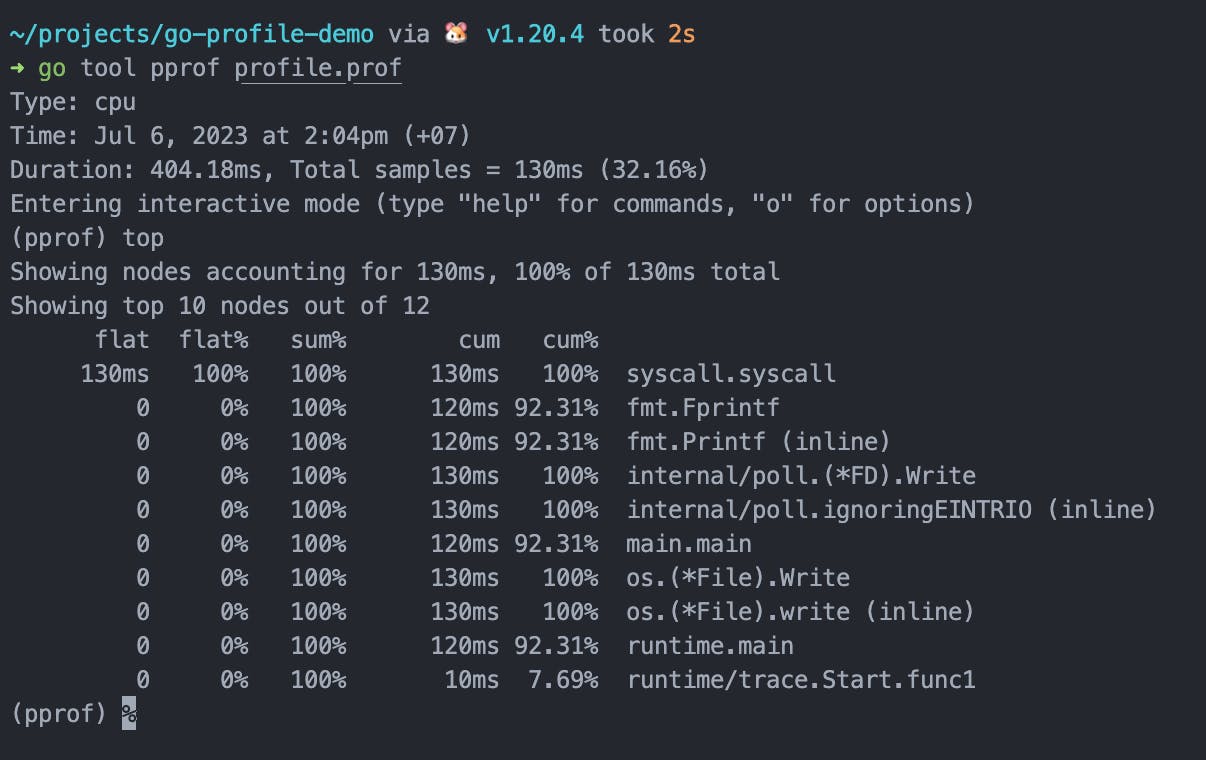
This will run the program and create a profile.prof file in the same directory as the main.go file. To analyze the profile, run the following command, which will give you an interactive shell to explore the profile:
go tool pprof profile.prof
To show the top functions by cpu usage, type the command top

In the example above, we saw how to create a CPU profile and analyze it using the pprof tool. The output showed the number of times each function was called, and the total time spent executing each function. This allowed us to identify functions that were consuming the most CPU time and potentially optimize them.
This allowed us to identify functions that were using excessive amounts of memory and potentially optimize them to reduce memory usage.
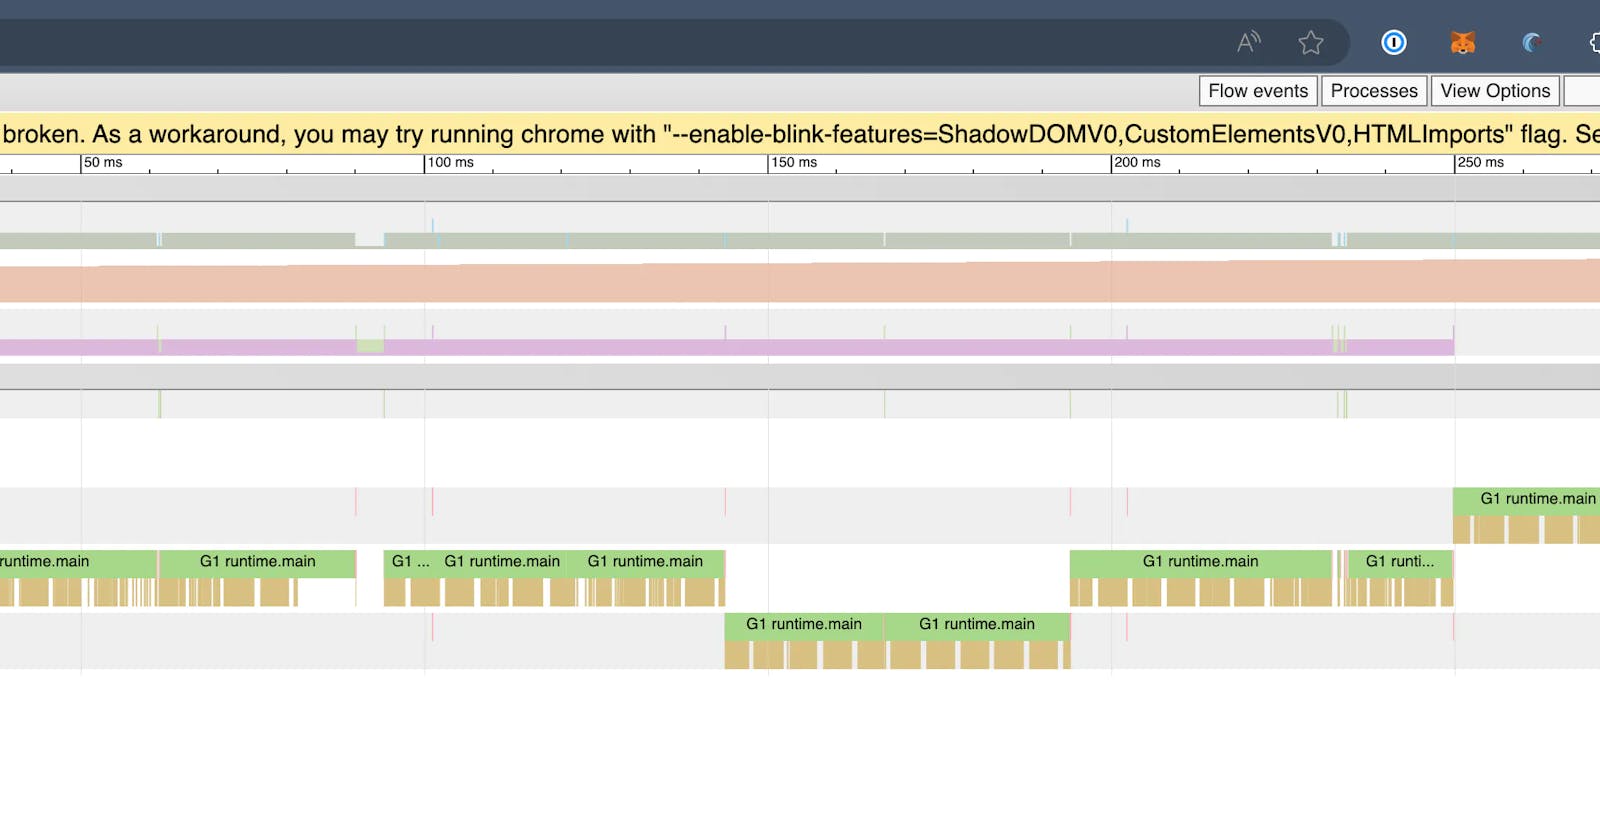
The next step is to collect and analyze the trace data. To analyze the trace data, you can use the go tool trace command followed by the name of the trace file:
go tool trace trace.out
This will launch a web-based visualization of the trace data, which you can use to find out how your program is running and identify performance issues.

You can also see details about the various goroutines and how the various processes ran! trace is an excellent tool for understanding various flow events, goroutine analysis, minimum mutator utilization, and much more!
Analyzing and fixing performance issues
After collecting performance data with pprof and trace, the next step is to analyze the data and identify possible performance issues.
To analyze the output of pprof, it is important to understand the different types of profiling data available. The most common types are CPU and memory profiles, which can help identify functions that consume a significant amount of resources and may be causing performance bottlenecks. Additionally, pprof can generate other types of profiles such as mutex contention and blocking profiles, which can assist in pinpointing synchronization and blocking issues. For instance, a high mutex contention rate may indicate that multiple goroutines are contending for the same lock, leading to blocking and decreased performance.
Trace data, as mentioned earlier, provides a more comprehensive picture of an application's behavior, encompassing goroutines, blocking operations, and network traffic. By analyzing trace data, one can identify sources of latency and performance issues, such as excessive network latency or inefficient algorithmic choices.
Once performance issues are identified, there are various methods to optimize performance. One common approach involves reducing memory allocations through object reuse and minimizing the use of large data structures. By decreasing the amount of memory allocation and garbage collection, CPU usage can be reduced, ultimately leading to improved program performance.
Another technique is employing asynchronous I/O or non-blocking operations to mitigate blocking operations like file I/O or network communication. This helps decrease the waiting time for I/O operations to complete, resulting in enhanced program throughput and overall efficiency.
Additionally, optimizing algorithms and data structures can have a significant impact on performance. Optimal selection of algorithms and data structures reduces the CPU time required for operations, thereby improving program performance.
Conclusion
We discussed the importance of optimizing Go applications to ensure optimal performance and user satisfaction. We cover common causes of performance issues, such as inefficient algorithms, blocking operations, and excessive memory usage. We introduce the pprof package and trace package for profiling and tracing Go programs, and provide an example of collecting and analyzing performance data. Finally, there are techniques for optimizing performance, including reducing memory allocations, employing asynchronous I/O, and optimizing algorithms and data structures.
Contributing
At Dwarves, we encourage our people to read, write, share what we learn with others, and contributing to the Brainery is an important part of our learning culture. For visitors, you are welcome to read them, contribute to them, and suggest additions. We maintain a monthly pool of $1500 to reward contributors who support our journey of lifelong growth in knowledge and network.
Love what we are doing?
Check out our products
Hire us to build your software
Join us, we are also hiring
Visit our Discord Learning Site
Visit our GitHub

