

Building Reliable Apps: Sentry and Distributed Tracing for Effective Monitoring


Introduction
In today's tech world, with its micro-services, cloud apps, and complex systems, how we make software has totally changed. These new ways give us huge power, but they also make new problems we need smart solutions for one big problem is knowing what's happening in all the parts of our app as things move around. Some big companies like Twitter, Uber, and Netflix have also recognized the significance of addressing this challenge and have integrated distributed tracing into their systems.
Distributed tracing is the solution we use. It's like a map that shows us how things move in our app, even when it's spread out. In modern apps, where lots of parts work together, finding problems and knowing how everything works can be tricky. But distributed tracing helps us do it. It's like a flashlight that helps us see where things slow down, find mistakes, and understand how our app works, even when it's big and complex.
The Importance of Distributed Tracing
At the core, the Dwarves Foundation team utilizes Sentry for monitoring product health. With distributed tracing, developers and operations teams gain a comprehensive visualization of request paths and time spent at each step. This proves invaluable during the project development and building process.
Key Benefits of Distributed Tracing:
Identifying Performance Bottlenecks: By scrutinizing request timelines during complex processes like the checkout in an e-commerce site, you can pinpoint delays and inefficiencies.
Visualizing Request Paths: Visual representations of how requests traverse various services allow quick identification of latency issues and bottlenecks.
Continuous Monitoring and Iteration: Utilize tracing for continuous monitoring and improvement, adapting to fluctuating traffic and demands.
Real-World Use Case: Optimizing E-commerce Checkout
Imagine developing an e-commerce website with a multifaceted checkout process involving services like user authentication, inventory management, payment processing, and order fulfillment. Distributed tracing would empower you to:
Identify Latency: Scrutinize request timelines during the checkout process to identify components causing delays.
Trace Request Flow: Visualize how checkout requests progress across services, highlighting bottlenecks.
Optimization and Iteration: Employ tracing for constant monitoring and enhancement, adapting to surges in user traffic.
Under the Hood: How Distributed Tracing Operates
Traces are composed of two fundamental components:
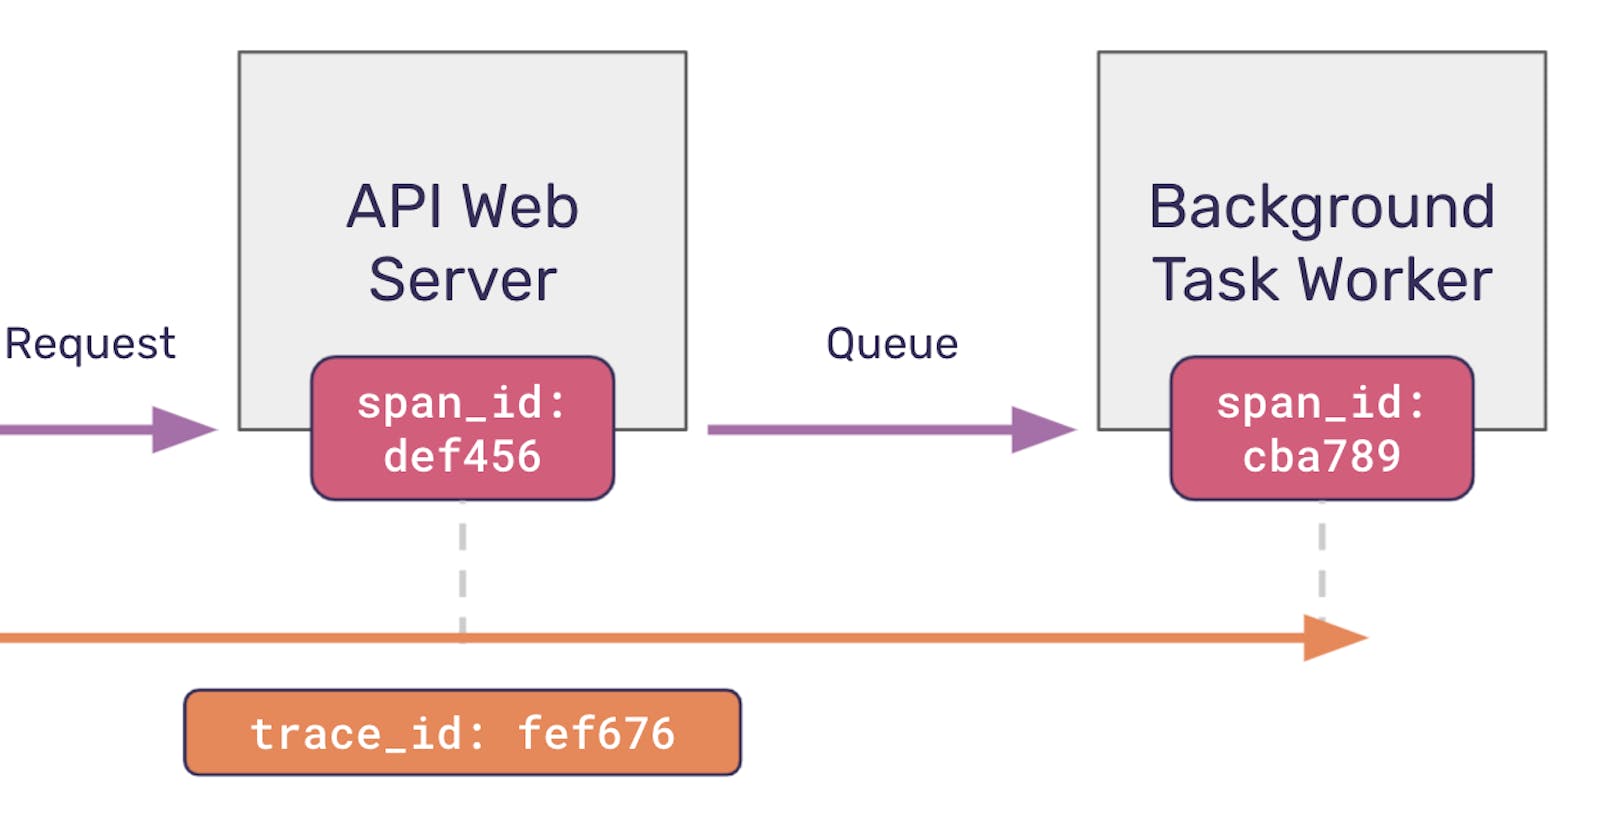
A span describes an operation or task that a service is doing. Spans can cover big operations, like a web server responding to an HTTP request, or very small ones, like calling a function.
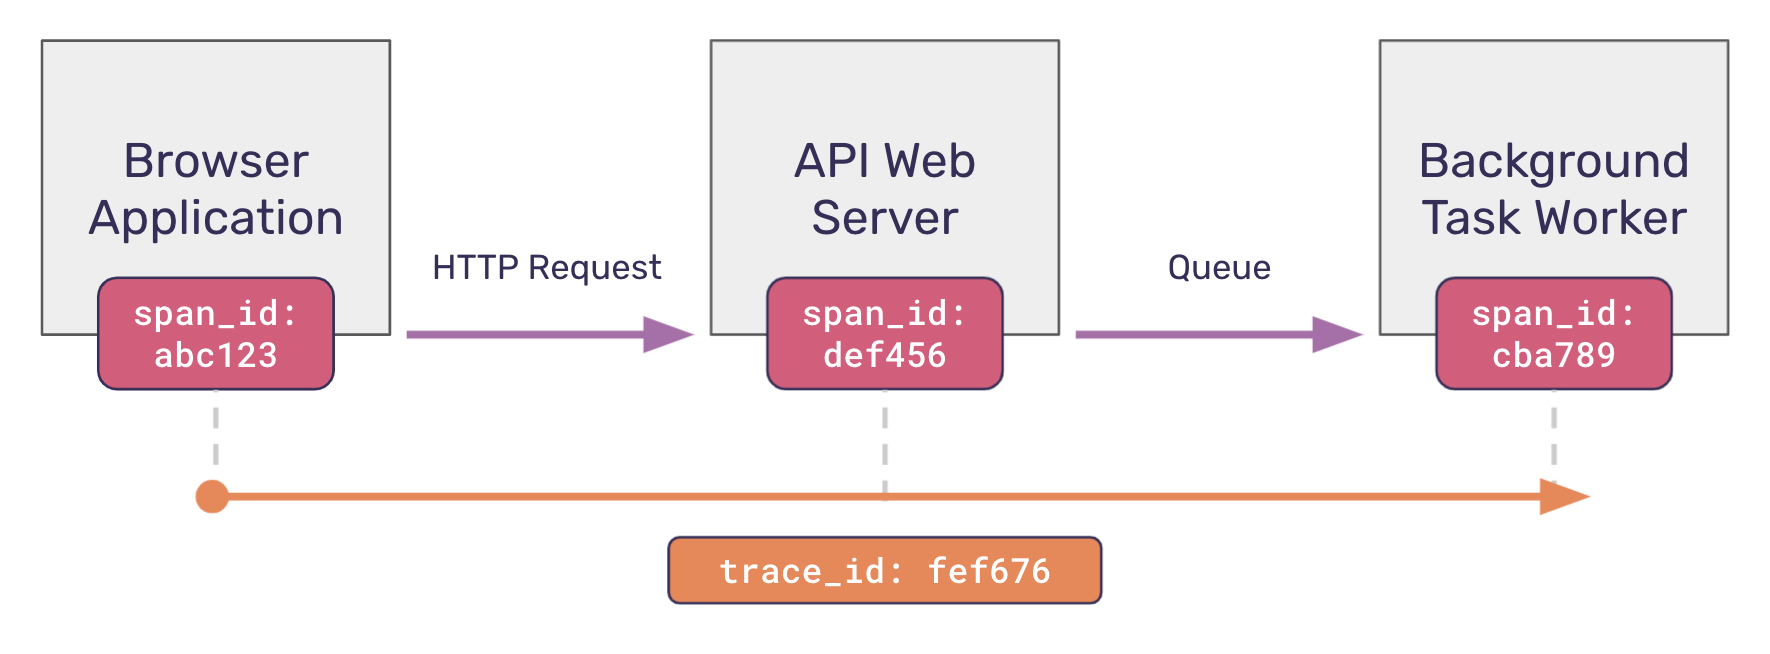
A trace describes the complete journey of one or more connected spans. If a trace connects spans from different services, it is called a distributed trace.
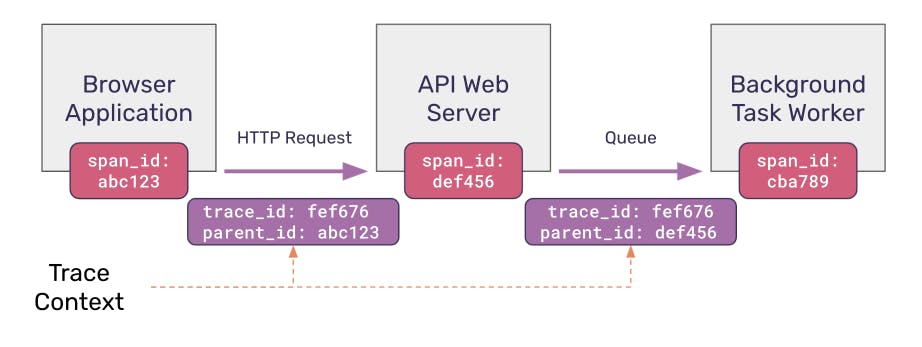
To maintain tracking order and trace the process, a trace context is attached to the request and sent between spans. The trace context usually has two values:
Trace identifier (or
trace_id): This is a unique identifier that is created in the root span. It identifies the entire trace. As we covered in the previous section, this trace identifier is passed down unchanged to all downstream services.Parent identifier (or
parent_id): This is thespan_idof the "parent" span that generated the current operation.
OpenTelemetry: Enabling Comprehensive Observability
OpenTelemetry, an open-source project, simplifies gathering and exporting telemetry data from applications with libraries, APIs, and tools across programming languages. This comprehensive telemetry provides insights into request and process flow, aiding the understanding of complex architectures. Its notable feature is the ability to trace requests across services by integrating trace information into application code, allowing tracking from one service to another. This data is then sent to backend systems, like observability platforms and log aggregators, for analysis and visualization.
Sentry: Transforming Traces into Insights
OpenTelemetry excels in capturing distributed traces, and Sentry builds on this by transforming raw trace data into actionable insights. Serving as an application monitoring and error tracking platform, Sentry enables real-time issue identification, diagnosis, and resolution for developers. Through the integration of OpenTelemetry with Sentry, organizations gain a deeper understanding of application performance and user experiences through distributed tracing data. Sentry's user-friendly interface visualizes traces as graphs, aiding in the pinpointing of bottlenecks, latency issues, and errors. This information empowers proactive identification and mitigation of performance bottlenecks, ensuring a seamless user experience and robust system reliability.
A Practical Distributed Tracing Example
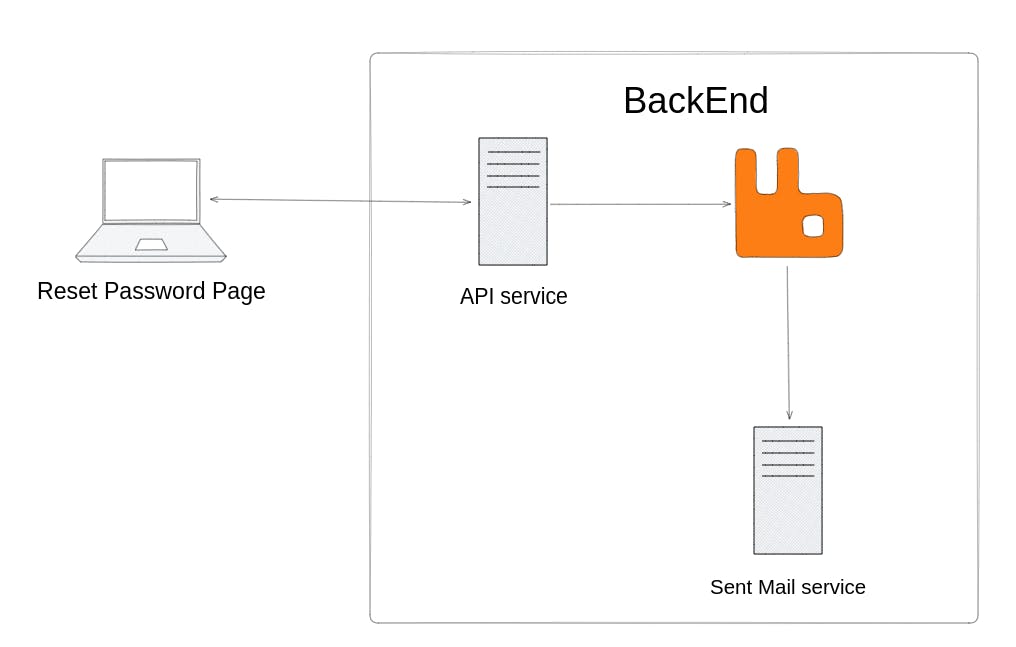
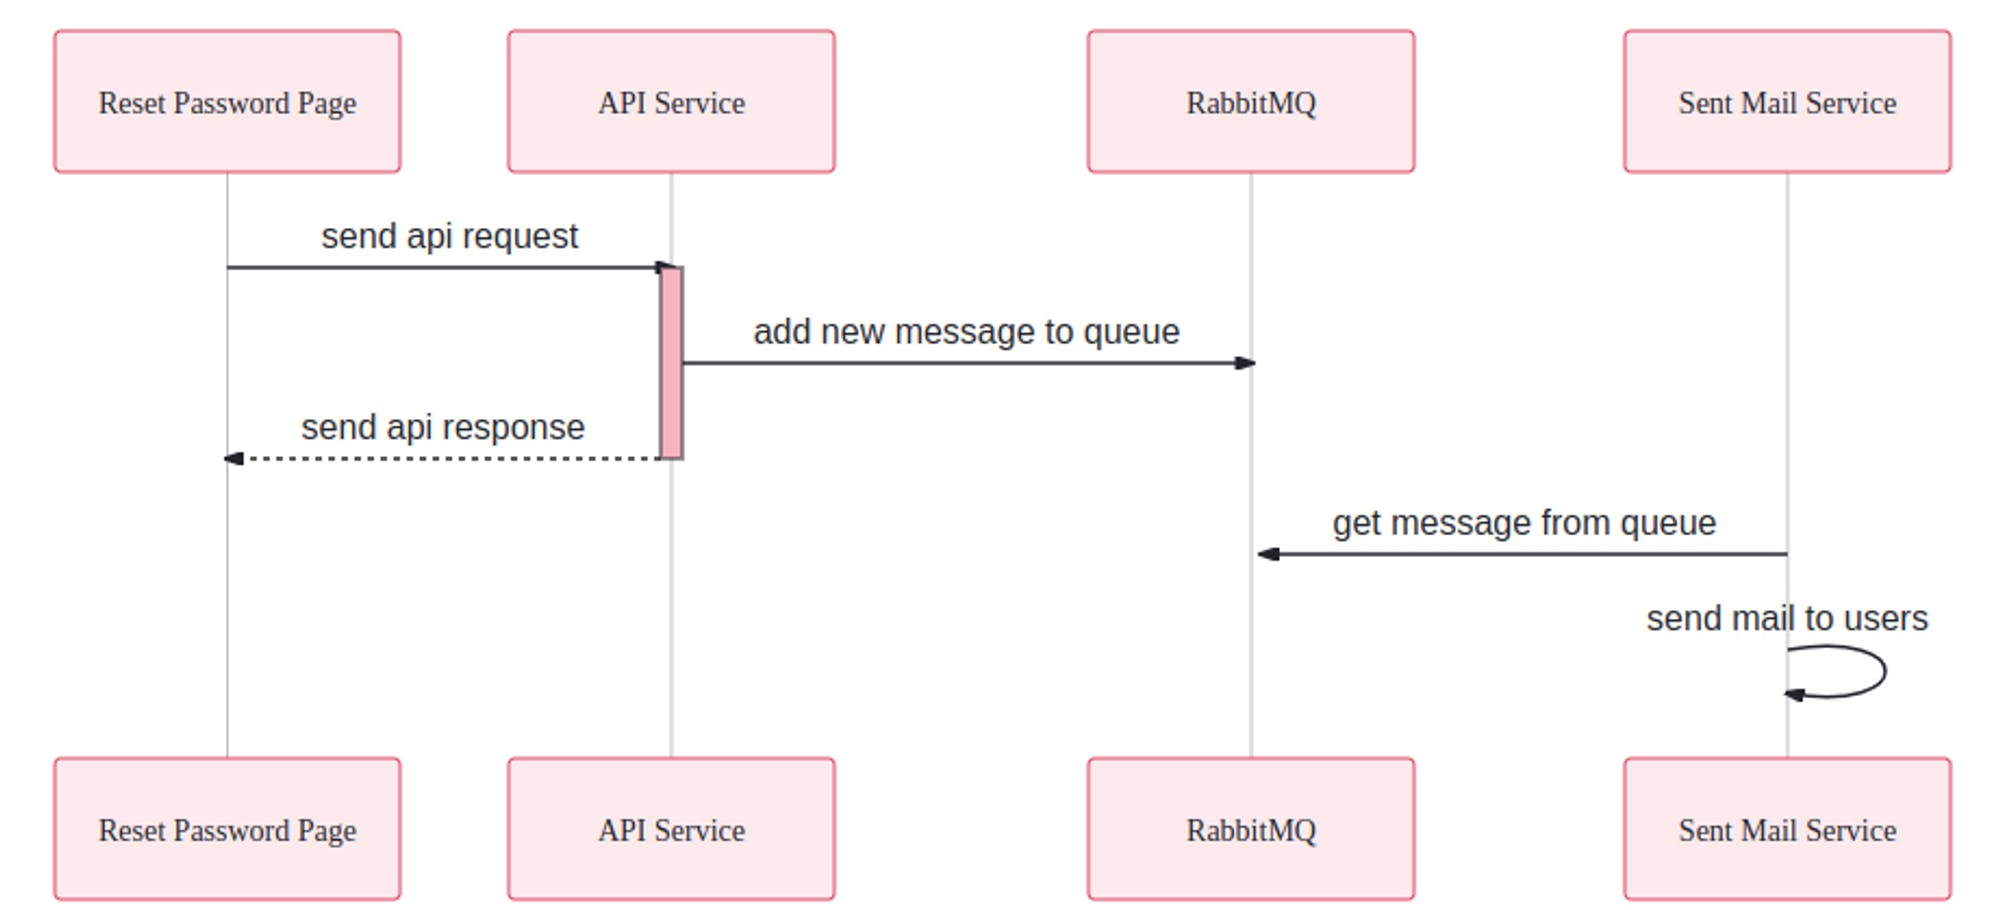
Assuming that we are implementing a feature that allows users to reset their passwords, we will omit any unnecessary components to simplify things. This system will consist of three basic parts:
Reset password page - ReactJs: UI that allows users to enter their email and submit it. When submitted, the page will send a request to the API service to process it.
API service - Go: the place where requests are received from the frontend and processed.
Sent mail service - Go: performs the task of sending a password reset email to the user's email. We will not handle the details here, but only perform fake tasks to ensure the simplest example for this.
Backend services will communicate with each other through RabbitMQ.
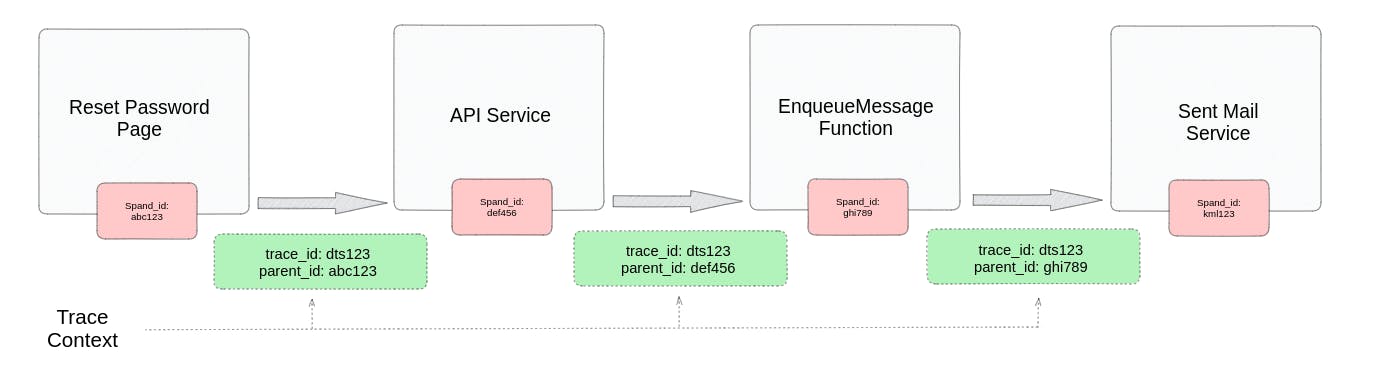
With the descriptions above, the reset password request will have to go through 4 main steps (4 spans):
Step 1 The reset password page will send an API request to the API service, along with the details of the tracing_id and parent_id (which is the span_id of the current span).
Step 2 The API service will receive the request and perform a call function enqueue message to push a new task to RabbitMQ. Here, the trace_id will remain the same and the parent_id will be updated to the current span_id to be sent.
Step 3 The EnqueueMessage function will push a new message into the queue along with the header containing the information of the new trace context.
Step 4 The Sent Mail service will retrieve messages from the queue and handle them in order.
Setting up our Frontend - Reset password page
We use ReactJs for our frontend. The first thing we need to do is to initialize the Sentry service. We create a sentryConfig.js file and add the following code:
import * as Sentry from "@sentry/react";

Sentry.init({
  dsn: process.env.REACT_APP_SENTRY_DSN,
  environment: process.env.REACT_APP_ENVIRONMENT,
  enableTracing: true,
  tracesSampleRate: 1.0,
  debug: true,
  integrations: [],
  instrumenter: "otel",
});

export default Sentry;
Then in the index.js file, we will import the created file to be able to interact with the Sentry service on the website:
import './sentryConfig.js';
Next, we will create the ForgotPasswordForm.js component to allow users to enter their email. We will perform tracing in this request, so we need to initialize Opentelemetry in the ForgotPasswordForm() function:
const provider = new WebTracerProvider({
  resource: new Resource({
      [SemanticResourceAttributes.SERVICE_NAME]: 'reset-password-page',
    })
});

provider.addSpanProcessor(new SimpleSpanProcessor(new ConsoleSpanExporter()));
provider.addSpanProcessor(new SentrySpanProcessor());

provider.register({
  contextManager: new ZoneContextManager(),
  propagator: new SentryPropagator(),
});

registerInstrumentations({
  instrumentations: [new FetchInstrumentation()],
  tracerProvider: provider
});
To send an event to the API service, we will use fetch with 2 special fields in the header: Sentry-Trace and Baggage. This is the way to help requests with the same traceID to know and link to each other.
const getData = (email, spanId, sentryId) => fetch('<http://localhost:3000/users/reset-password>', {
    method: 'POST',
    headers: {
        'Content-Type': 'application/json',
        'Sentry-Trace': `${sentryId}-${spanId}-1`,
        'Baggage': `sentry-environment=${process.env.REACT_APP_ENVIRONMENT},sentry-public_key=${process.env.REACT_APP_SENTRY_PUBLIC},sentry-trace_id=${sentryId}`
    },
    body: JSON.stringify({ email }),
});
The postfix 1 in the above code indicates whether the trace is sampled. Sampling is the process of selecting a subset of traces to collect data for, in order to reduce overhead. If sampled is 1, it means the current trace is being captured, if not the value is 0. But in this example, we capture all traces so the value here always 1.
In this section, besides the email provided by the user, we also need to retrieve the spanId and sentryId from the context. The initialization of the span and context can be done as follows:
const singleSpan = webTracerWithZone.startSpan('handleSubmit');
context.with(trace.setSpan(context.active(), singleSpan), () => {
      // get trace ID
      const traceId = trace.getSpan(context.active()).spanContext().traceId;
      const spanId = trace.getSpan(context.active()).spanContext().spanId;
    // call request and handle response
}
// end the span
singleSpan.end();
Setting up our Backend
The Backend will consist of 2 main services as mentioned above. While the API service will receive HTTP requests from the Frontend and push the tasks that need to be performed further into RabbitMQ, the Sent mail service will wait for messages added to RabbitMQ and process them in order
API service
The first and essential step is to initialize Sentry and OpenTelemetry services:
// Sentry
err = sentry.Init(sentry.ClientOptions{
    Dsn:              os.Getenv("SENTRY_DSN"),
    Environment:      os.Getenv("ENVIRONMENT"),
    EnableTracing:    true,
    TracesSampleRate: 1.0,
    Debug:            true,
})
if err != nil {
    log.Fatalf("sentry.Init: %s", err)
}

// OpenTelemetry
tp := sdktrace.NewTracerProvider(
    sdktrace.WithSpanProcessor(sentryotel.NewSentrySpanProcessor()),
)
otel.SetTracerProvider(tp)
otel.SetTextMapPropagator(sentryotel.NewSentryPropagator())
To enable request tracing with gin, we will add OpenTelemetry middleware to it using the following syntax:
r.Use(otelgin.Middleware("api-service")) // "go.opentelemetry.io/contrib/instrumentation/github.com/gin-gonic/gin/otelgin"
About the CORS, we need to add Baggage and Sentry-Trace to avoid CORS error caused by Sentry headers:
// Apply CORS middleware
config := cors.DefaultConfig()
config.AllowOrigins = []string{"*"}                                                // Update with your frontend URL
config.AllowMethods = []string{"GET", "POST", "PUT", "PATCH", "DELETE", "OPTIONS"} // Allow the required methods
config.AllowHeaders = []string{"Origin", "Content-Length", "Content-Type", "Baggage", "Sentry-Trace"}
r.Use(cors.New(config))
This is the function for handling reset password requests:
func (h handler) ResetPasswordHandler(c *gin.Context) {
    const spanName = "resetPasswordHandler"
    newCtx, span := otel.Tracer(spanName).Start(c.Request.Context(), spanName)
    defer span.End()

    // Update c ctx to newCtx
    c.Request = c.Request.WithContext(newCtx)

    traceID := c.GetHeader("Sentry-Trace")
    log.SetFormatter(&log.JSONFormatter{})
    l := log.WithFields(log.Fields{
        "trace_id": traceID,
        "span_id":  span.SpanContext().SpanID().String(),
    })
    l.Info("Receive reset password request !")

    var request models.ResetPasswordRequest
    if err := c.ShouldBindJSON(&request); err != nil {
        l.Error("Error parsing request body")
        c.JSON(http.StatusBadRequest, gin.H{"error": "Bad Request"})
        return
    }

    err := h.queue.EnqueueMessage(c.Request.Context(), request.Email)
    if err != nil {
        l.Error("Error enqueue message")
        c.JSON(http.StatusInternalServerError, gin.H{"error": err.Error()})
        return
    }

    c.JSON(http.StatusOK, models.MessageResponse{
        Message: "Password reset email sent",
    })
}
In this function, we will initialize a new span and update the tracing context. This context will be sent through its child spans (in the function EnqueueMessage()) and continue to be updated thereafter. In the EnqueueMessage function, the context will be injected and then propagated through the header of the message before enqueueing it.
func (r *RabbitMQ) EnqueueMessage(ctx context.Context, email string) error {
    // start span
    parentSpanID := utils.ExtractParentSpantID(ctx)
    const spanName = "EnqueueMessage"
    opts := []oteltrace.SpanStartOption{
        oteltrace.WithAttributes(attribute.KeyValue{Key: attribute.Key("messaging.system"), Value: attribute.StringValue("rabbitmq")}),
        oteltrace.WithAttributes(attribute.KeyValue{Key: attribute.Key("messaging.operation"), Value: attribute.StringValue("publish")}),
    }

    ctx, span := otel.Tracer(spanName).Start(ctx, spanName, opts...)
    defer span.End()

    log.SetFormatter(&log.JSONFormatter{})
    l := log.WithFields(log.Fields{
        "parent_id": parentSpanID,
        "trace_id":  span.SpanContext().TraceID().String(),
        "span_id":   span.SpanContext().SpanID().String(),
        "email":     email,
    })
    l.Info("Enqueue message !")

    messageBytes, err := json.Marshal(QueueMessage{Email: email})
    if err != nil {
        l.Errorf("Failed to marshal message to JSON: %v", err)
        return err
    }

    body := amqp.Publishing{
        ContentType: "text/plain",
        Body:        messageBytes,
    }

    // propagate trace context
    body.Headers = utils.CtxToHeader(ctx)
    err = r.Channel.Publish(
        "",           // exchange
        r.Queue.Name, // routing key
        false,
        false,
        body)
    if err != nil {
        l.Errorf("Failed to publish message: %v", err)
        return err
    }

    return nil
}
Sent Mail service
Regarding the sent mail service, the first and indispensable task is to initialize the Sentry and OpenTelemetry services, which will be performed similarly to the API service. After that, the dequeue and message processing tasks will proceed normally, except that we need to convert from headers to tracing context.
...
    const spanName = "handleSentMailMessage"
    msg := string(d.Body)

    headers := d.Headers
    convertedHeaders := make(map[string]string)
    for k, v := range headers {
        convertedHeaders[k] = v.(string)
    }

    ctx := otel.GetTextMapPropagator().Extract(context.Background(), propagation.MapCarrier(convertedHeaders))
    parentSpanID := oteltrace.SpanFromContext(ctx).SpanContext().SpanID().String()
    opts := []oteltrace.SpanStartOption{
        oteltrace.WithAttributes(attribute.KeyValue{Key: attribute.Key("messaging.system"), Value: attribute.StringValue("rabbitmq")}),
        oteltrace.WithAttributes(attribute.KeyValue{Key: attribute.Key("messaging.operation"), Value: attribute.StringValue("process")}),
    }

    // create span with context
    ctx, span := otel.Tracer(spanName).Start(ctx, spanName, opts...)
...
Output

The results displayed on the Sentry we will be able to see the flow of the request and also the time and events that took place in it.
Conclusion
Through this article we learned the definition and keywords of distributed tracing, understood how it works and why we should use it. Then, through a practical example, we know how to implement distributed tracing in a system with the support of Sentry and OpenTelemetry.
You can find the full source code on our GitHub here
Contributing
At Dwarves, we encourage our people to read, write, share what we learn with others, and contributing to the Brainery is an important part of our learning culture. For visitors, you are welcome to read them, contribute to them, and suggest additions. We maintain a monthly pool of $1500 to reward contributors who support our journey of lifelong growth in knowledge and network.
Love what we are doing?
Check out our products
Hire us to build your software
Join us, we are also hiring
Visit our Discord Learning Site
Visit our GitHub
References
https://blog.sentry.io/distributed-tracing-101-for-full-stack-developers/
https://www.aspecto.io/blog/opentelemetry-go-getting-started/